- Published on
CausalFlow: A Visual Workbench for Bayesian Networks
- Authors

- Name
- Shuqi Wang

Setting different evidence values and watching the posteriors change in real time.
Why I Built This
During a course on probabilistic graphical models, I kept running into the same problem: the tools for working with Bayesian Networks were either behind a MATLAB paywall, stuck in old desktop UI conventions, or written as pure Python libraries that assumed I did not want to see the network I was building.
I wanted something simpler:
- open a browser,
- drag nodes around,
- draw arrows,
- set evidence,
- and watch probabilities update immediately.
Basically, a small flight simulator for causal reasoning.
So I built CausalFlow.
What It Does
CausalFlow is an open-source, browser-based workbench for building, training, and querying Bayesian Networks. The core loop is:
Build a DAG -> define probabilities -> set evidence -> read posteriors.
Three Ways to Build a Network
The tool supports three distinct workflows, depending on what you're starting with:
1. Data-Driven — You have a CSV dataset.
Upload a file, and CausalFlow detects discrete variables and state spaces. From there, you can either use the built-in hill-climbing structure search or draw edges manually. Parameters are fitted with maximum likelihood estimation.
2. Expert Knowledge — You have no data, but you understand the domain.
Create nodes from scratch, define their states (High, Low, Normal), assign prior probabilities, and draw causal arrows. CausalFlow generates editable conditional probability tables based on the structure you specify.
3. Hybrid — You have some data and some intuition.
Upload a CSV to bootstrap part of the network, then add expert-defined nodes with manual priors. Wire them together and train the model.
A Walkthrough
Let me walk through a typical session to show how the pieces fit together.
Step 1: Start with a Clean Canvas
When you first open CausalFlow, you get an empty canvas with a sidebar. The sidebar is the control panel for uploading data, adding nodes, and managing the workflow.
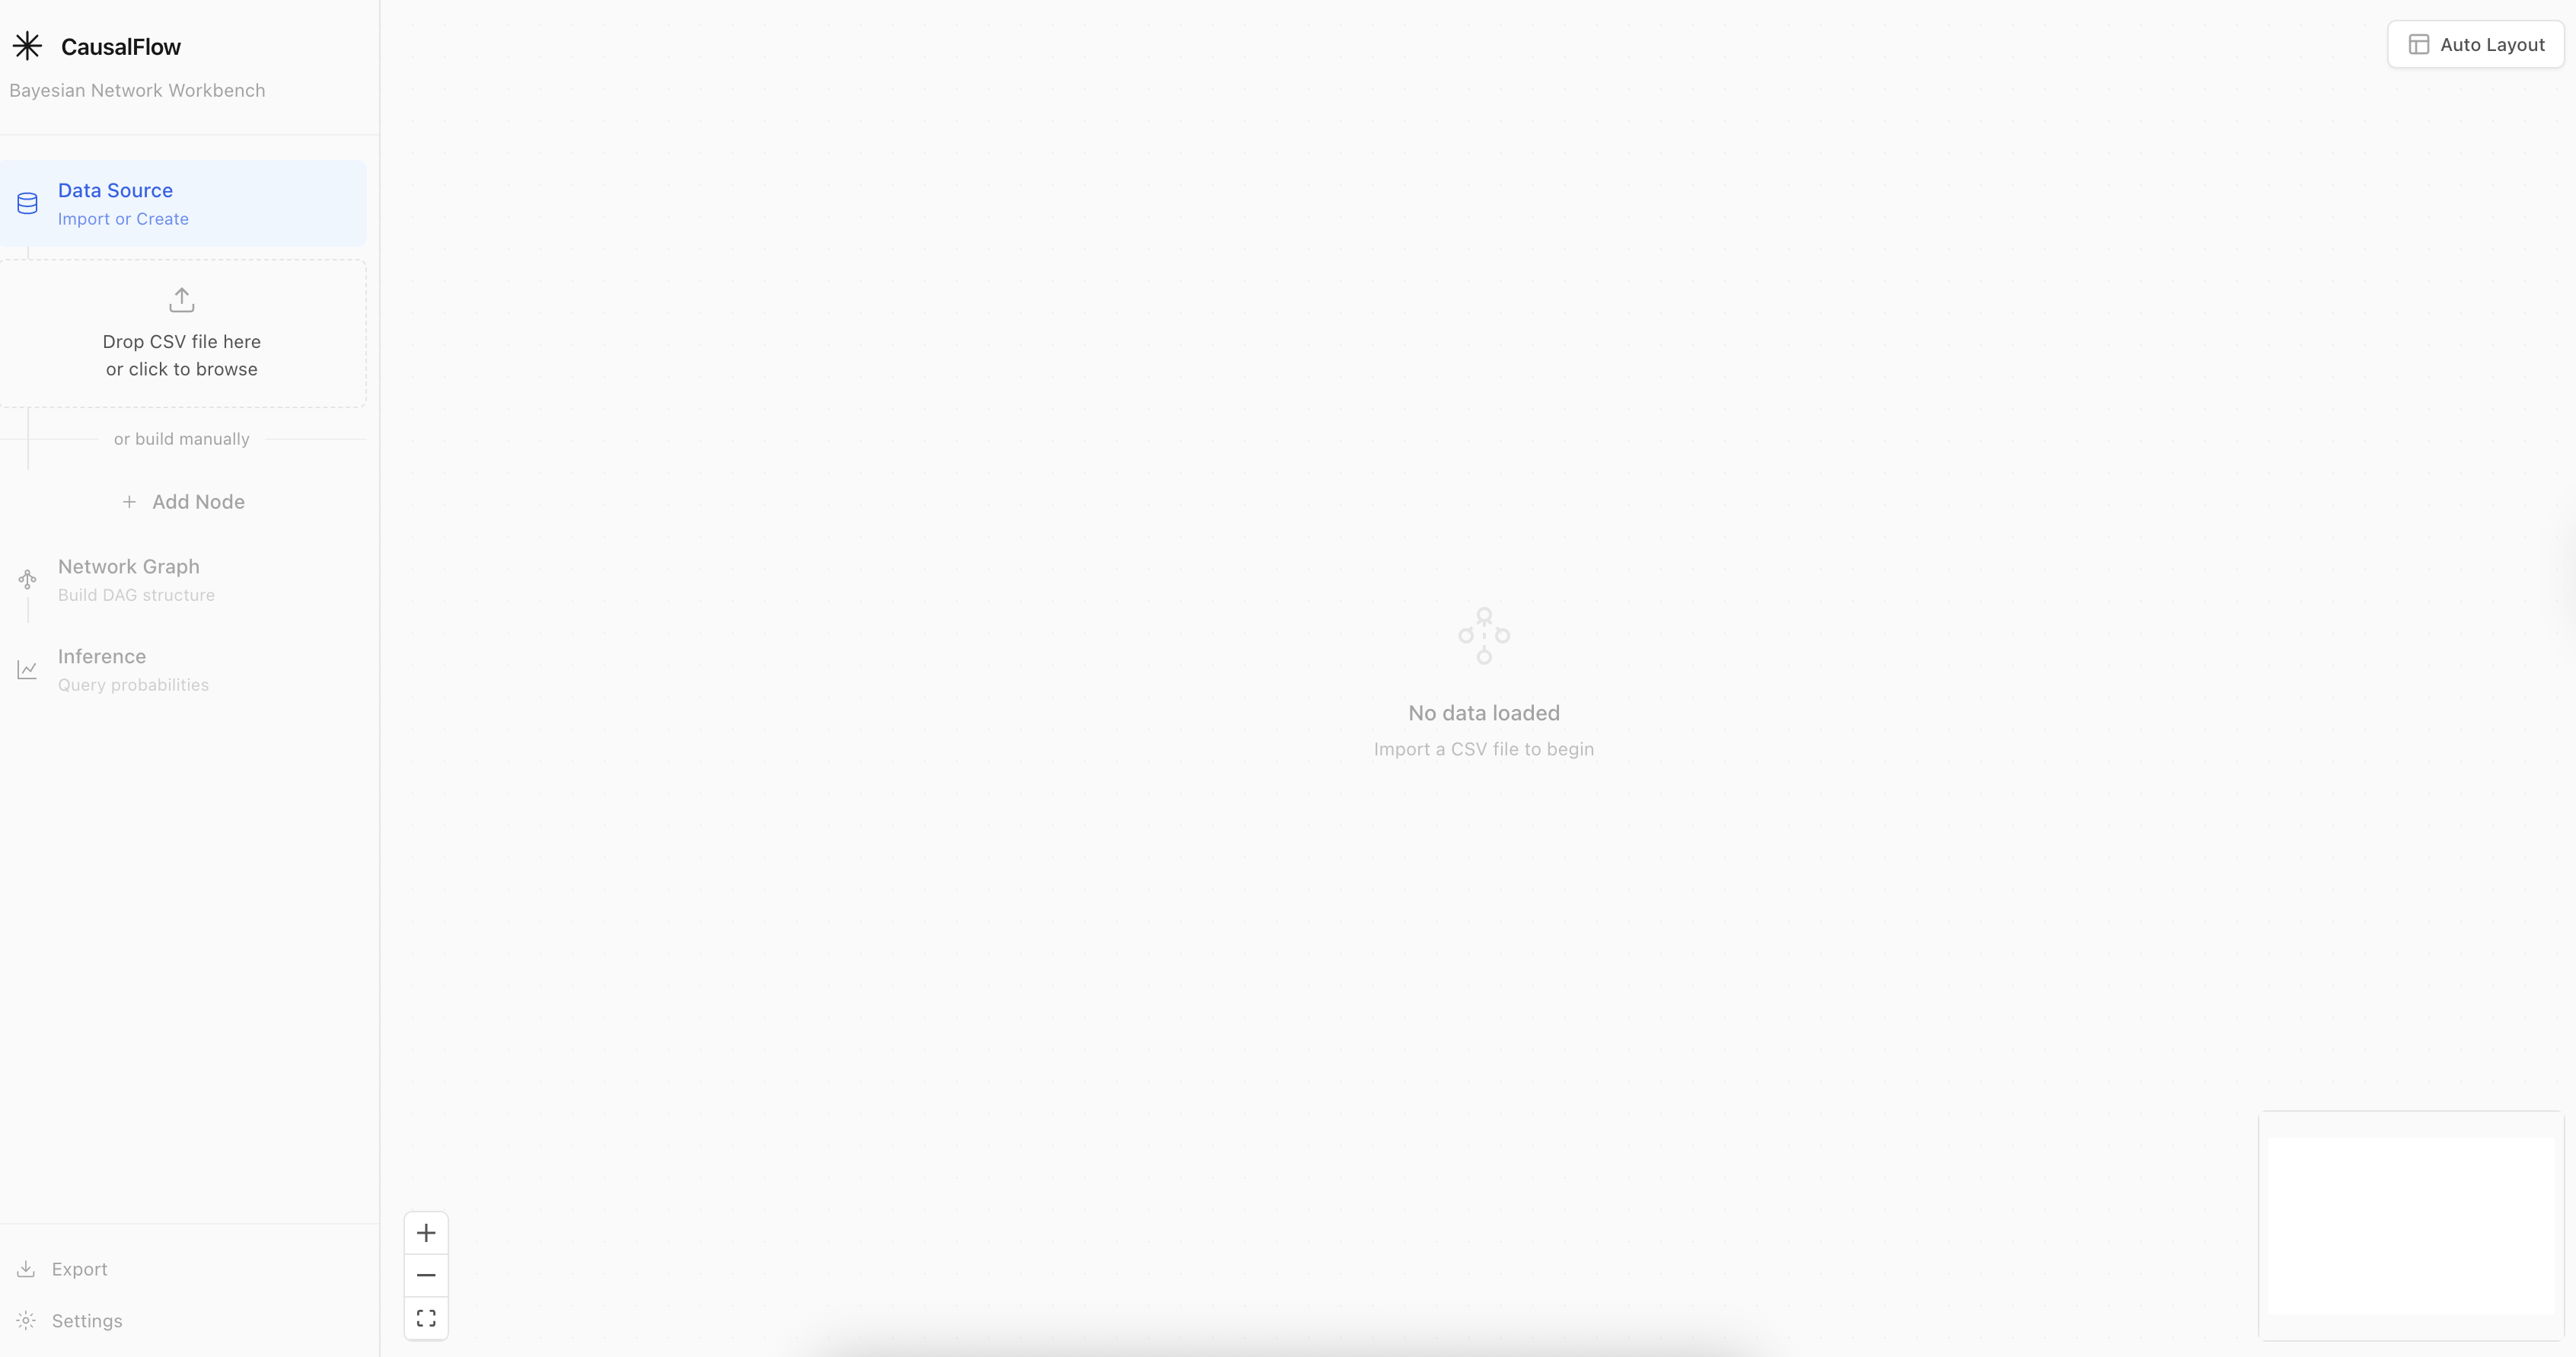
The starting canvas. Everything begins here.
Step 2: Build Your Graph
There are two paths here. If you uploaded a CSV, nodes appear automatically based on the data columns. Otherwise, click Add Node and define one manually: give it a name, list possible states, and optionally assign a prior probability distribution.
Once your nodes are on the canvas, draw edges between them by dragging from one handle to another. Each edge represents a causal claim: "this variable directly influences that one."
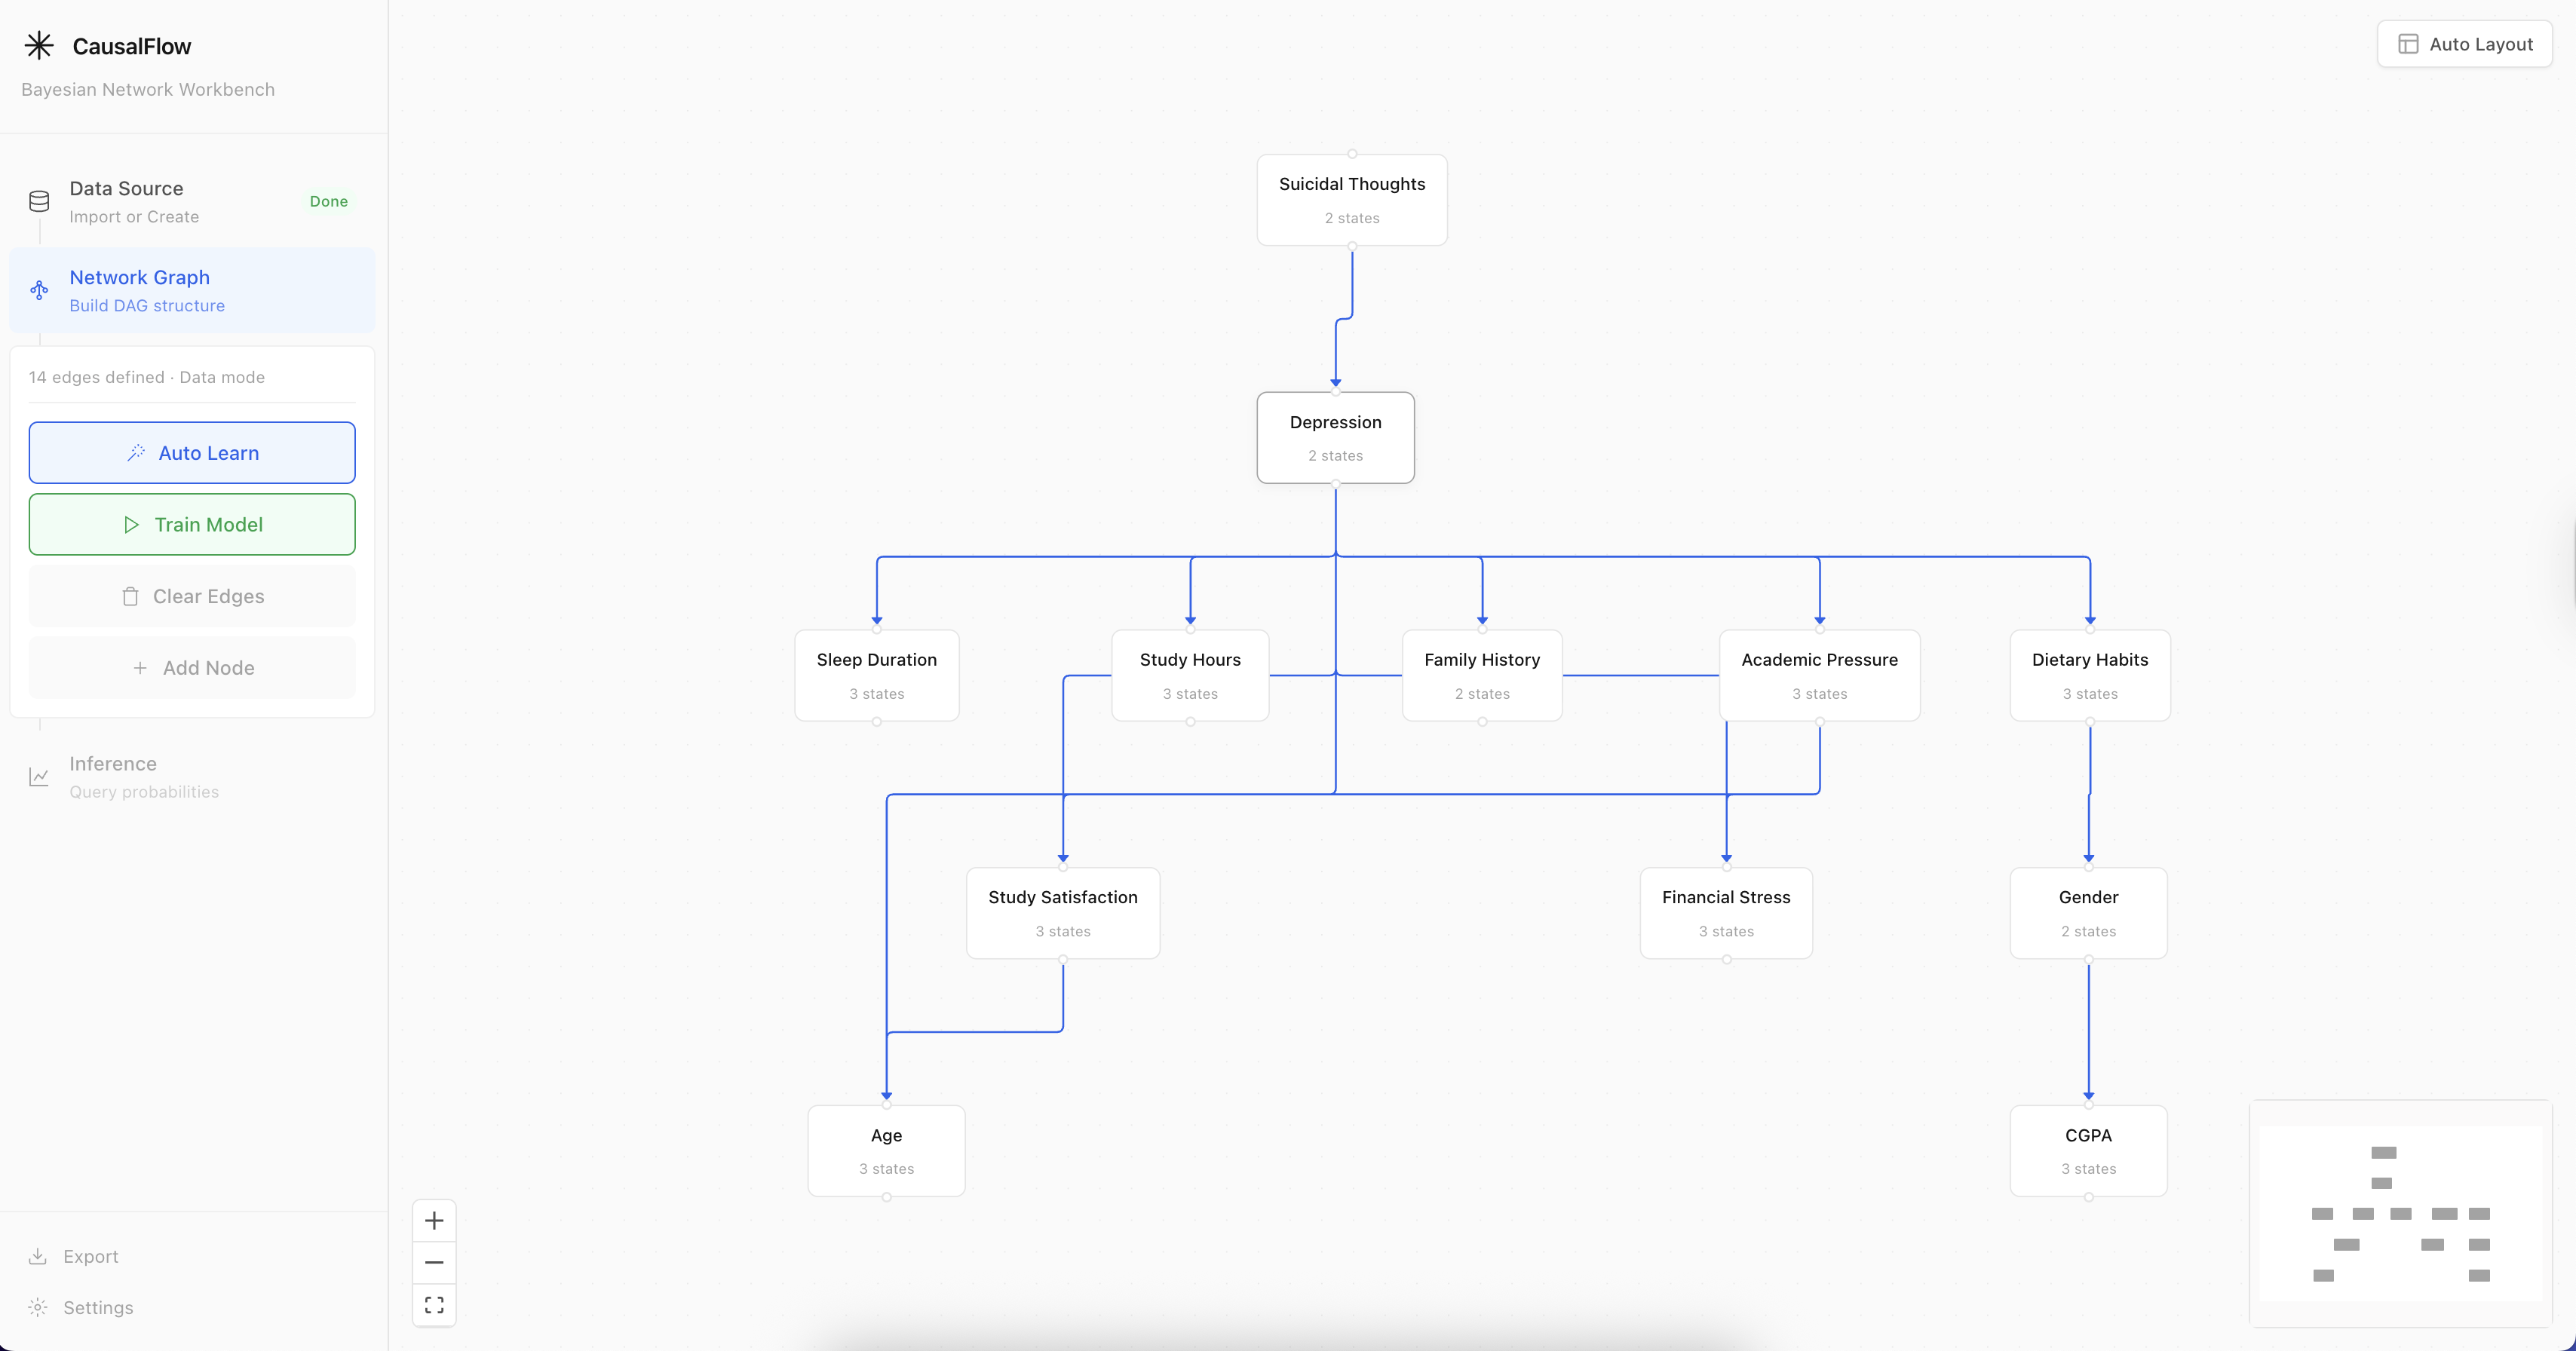
Constructing a DAG by connecting nodes. The sidebar shows each node's states and priors.
The layout can get messy quickly, so there is an auto-layout button powered by Dagre to arrange the graph into a cleaner hierarchy.
Step 3: Train & Infer
Click Train Model to compile the network. Behind the scenes, CausalFlow builds a pgmpy Bayesian Network, constructs conditional probability tables, validates the DAG, and initializes a variable elimination inference engine.
Now the fun part: click any state on any node to set it as evidence. The moment you do, every other node's probability distribution updates. You can see how information propagates through the graph instead of treating inference as a black box.
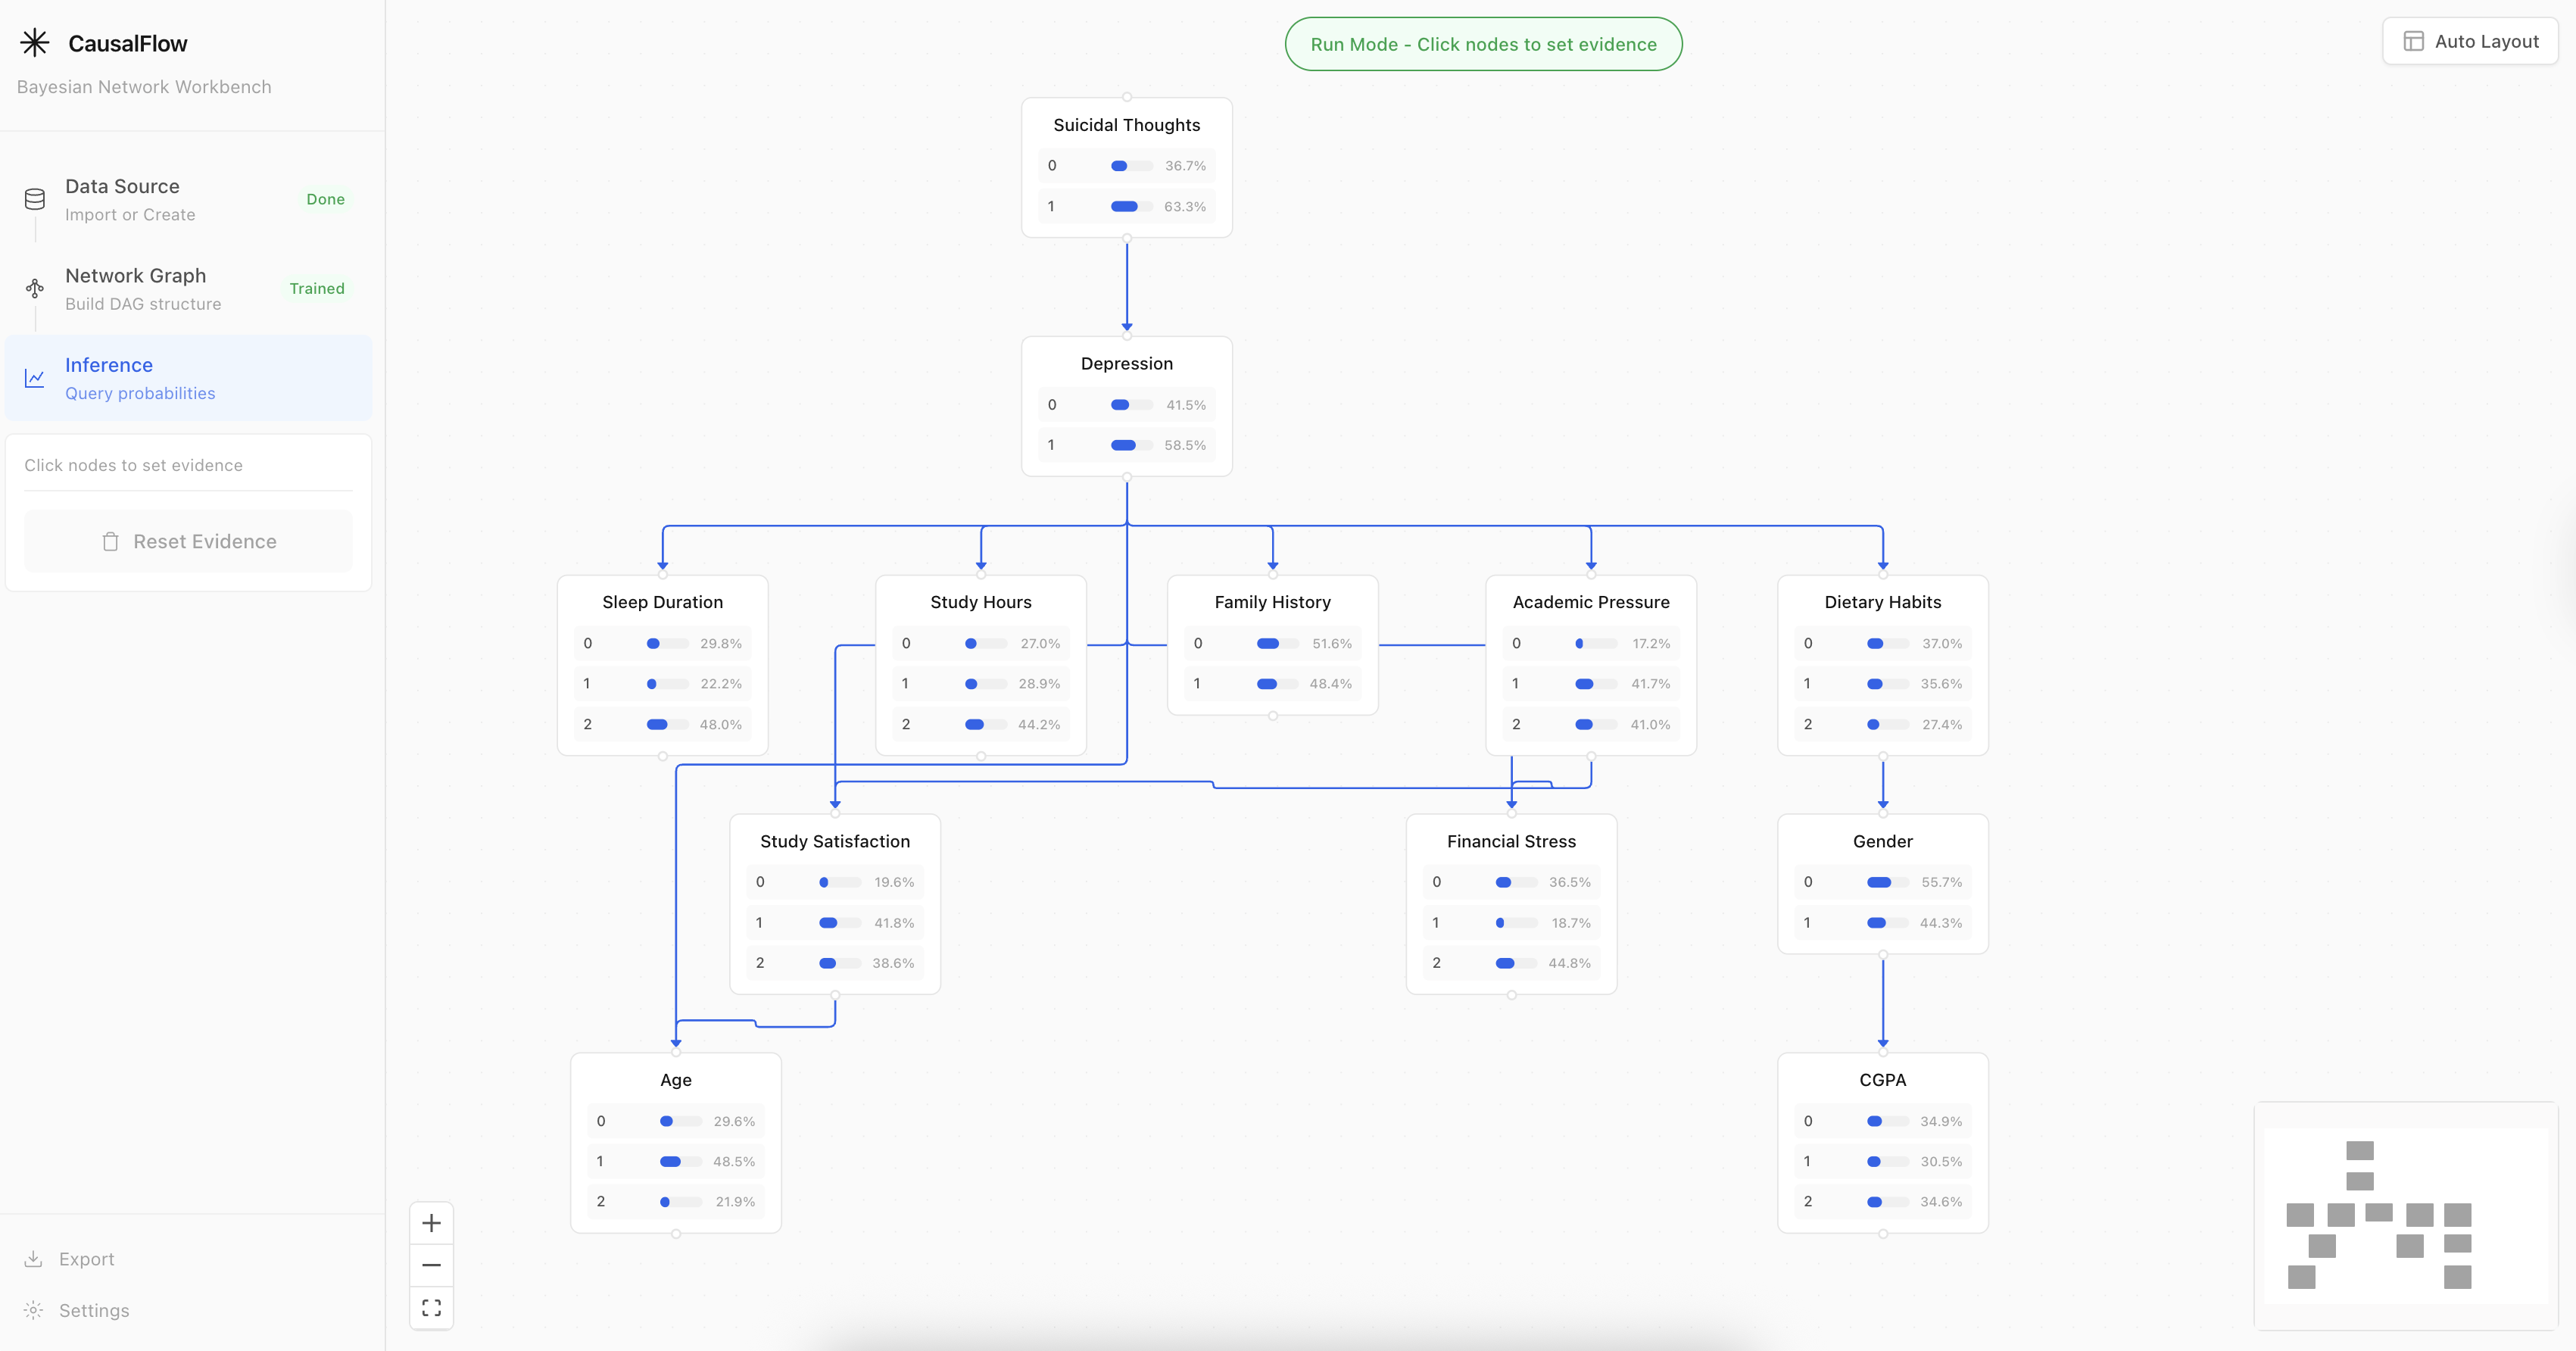
After setting evidence, posterior probabilities update across the entire network.
And here's the evidence propagation in action:
Setting different evidence values and watching the posteriors change in real time.
Under the Hood
For those curious about the architecture, CausalFlow is a React + FastAPI application. The frontend handles the visual and interactive layer; the backend runs the probabilistic inference.
┌─────────────────────────┐        ┌──────────────────────────┐
│       Frontend          │  REST  │        Backend           │
│                         │◄──────►│                          │
│  React 19 + React Flow  │  API   │  FastAPI + pgmpy         │
│  Zustand · Tailwind     │        │  Variable Elimination    │
│  Dagre · Recharts       │        │  Hill-Climbing (BIC/K2)  │
└─────────────────────────┘        └──────────────────────────┘
A few implementation details that might be interesting:
- Causal CPTs: When you draw an edge, CausalFlow generates a default CPT with a visible causal effect. The parent's i-th state biases the child toward its i-th state. This is deliberate: if you draw an arrow, you should see it do something.
- CPT Editor: If the defaults don't match your domain, you can open the CPT editor on any child node and dial in the exact conditional probabilities yourself. Full table UI with real-time sum validation.
- Structure Learning: The hill-climbing algorithm evaluates candidate structures using BIC or K2 scoring, starting from an empty graph and greedily adding, removing, or reversing edges until the score plateaus.
The most useful design choice was keeping the model state visible. For learning, that matters. A probability tool should not feel like a form submission where the answer appears at the bottom. It should feel like an instrument panel.
Quick Start
Try it online — no setup needed:
Or run it locally:
git clone https://github.com/howtoexitvim/causal-flow.git && cd causal-flow

# Backend
cd backend
python -m venv venv && source venv/bin/activate
pip install -r requirements.txt
uvicorn main:app --reload        # → http://localhost:8000

# Frontend (new terminal)
cd frontend
npm install && npm run dev        # → http://localhost:5173
Docker:
docker compose up -d --build # → http://localhost
What's Next
There's a lot I still want to do:
- Visual link strength — Render edges as thick or thin based on the magnitude of the CPT's causal effect.
- D-separation queries — Let users visually test conditional independence.
- Export/Import — Save and share network definitions as JSON.
- Sensitivity analysis — How much does changing one CPT entry shift the final posterior?
If any of this sounds interesting, PRs are welcome. The repo is here. The screenshot sources live under docs/images.
The best way to understand Bayesian Networks is to play with one. CausalFlow is my attempt to make that play loop fast, visual, and inspectable.